Browser efficiency comparison - Webdriver
Windows 10 Creator's Update
Methodology summary
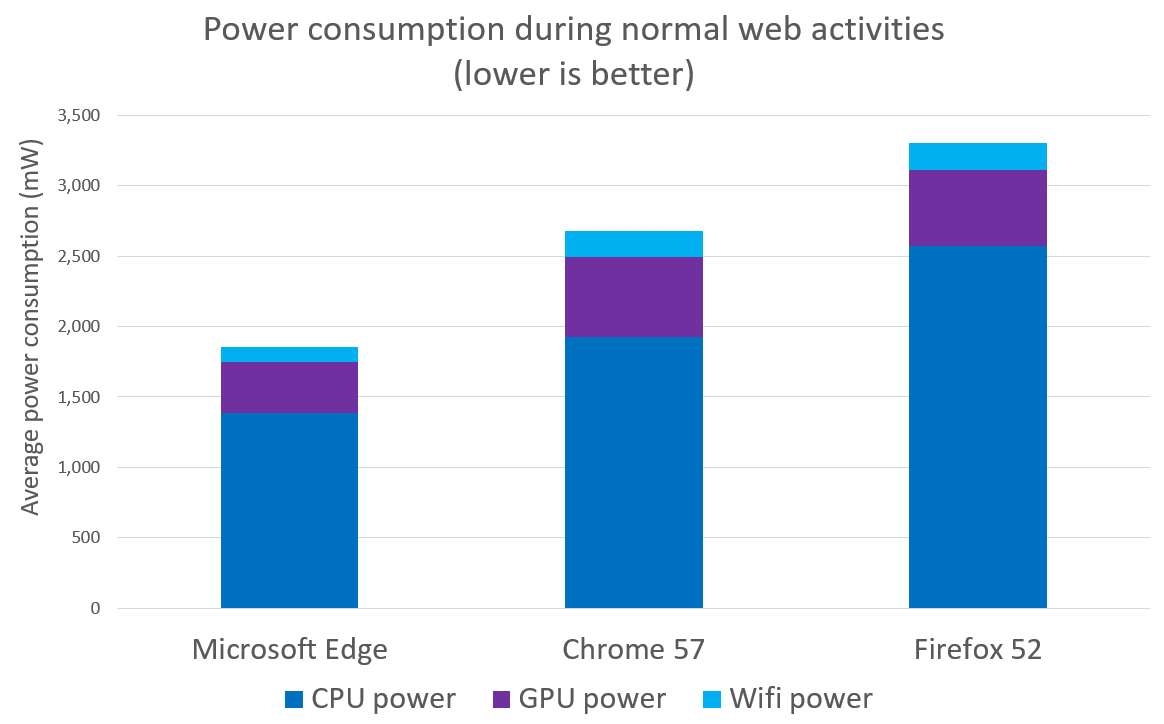
The Microsoft Edge team measured the average power consumption of the CPU, GPU, and Wifi antenna while Microsoft Edge, Chrome, and Firefox ran a representative set of user activities in each browser, automated through WebDriver.
These tests were done on four Surface Books running the Windows 10 Creator's Update (build 15063) and connected to the Internet through Wifi. Actual power consumption of the CPU, GPU, and Wifi antenna were measured using onboard Maxim chips, and read through Windows Performance Recorder.
Results summary
The total CPU, GPU, and Wifi antenna power consumption was measured on the same workload using Chrome, Firefox, and Microsoft Edge, running on the Windows 10 Creator's Update (15063). Based on an average of at least 16 iterations per browser, Microsoft Edge used:
- 31% less power than Chrome 57
- 44% less power than Firefox 52
Methodology details
Computer setup
The test was performed on four separate Surface Book laptops running the Windows 10 Creator's Update (build 15063). These computers were configured to the following settings, to increase consistency between measures and reduce tasks that may start during the measurement and interfere with the results, while still representing a realistic user setup:
- Display brightness was set to 50%
- Location was disabled
- Bluetooth was disabled
- Quiet hours were enabled
- Device was connected to a wireless network
- Defender cache was completely built
- Defragmentation was temporarily disabled
- Ambient light sensor was disabled
- Windows update was temporarily disabled
- "New network found" prompts were disabled
- Defender was running normally and up to date
- Device was physically unplugged and running on battery
- Volume was muted
- Windows Battery Saver mode was not set to activate
- Bitlocker was disabled
- The cache was cleared on each browser
OS and browser versions
| OS | Windows 10 Pro 15063.0 |
| Microsoft Edge | Microsoft Edge 40.15063.0.0 |
| Chrome | Google Chrome 57.0.2987.133 (64-bit) |
| Firefox | Firefox 52.0.1 (32-bit) |
Hardware
| Processor | i5-6300U @ 2.4GHz 2.5GHz |
| Memory | 8G |
| Graphics | Intel HD Graphics 520 |
Automation
Each browser was automated using WebDriver, a cross-platform tool designed for automating web browsing, and implemented by the major browsers. While the power draw was being measured, WebDriver executed the following activities:
Note that pauses are included throughout this workload, but are not included in this description for simplicity.
- Open the respective browser
- Navigate to Gmail.com
- Log in to Gmail
- Open and then close several messages in the inbox
- Open a new tab
- In the new tab, navigate to BBC News
- Click on one of the top stories and scroll through it
- Navigate to Yahoo, and then click on "News"
- Open a story and scroll through it
- Open a new tab
- In the new tab, navigate to a video on Youtube.com: "Microsoft Design: Connecting Makers"
- Watch the video for 90s
- Navigate to Facebook.com
- Log in to Facebook
- Scroll through the feed on Facebook
- Open a new tab
- In the new tab, navigate to Amazon.com
- In the search box, enter "Game of Thrones" and press enter
- Click on "Game of Thrones Season 1"
- Scroll down to the reviews
- Navigate to the Wikipedia article on "United States"
- Scroll through the article
- Navigate to Google.com
- Search for "Seattle"
- Navigate to ESPN.com
- Scroll through the homepage
- Navigate to Twitter.com
- Scroll through several of the publicly promoted tweets on the homepage
- Navigate to the Instagram page for the "New York Public Library"
- Scroll down to, and click on, the "Load more" button
- Scroll through several pages of the infinite list
- Close the browser
The code used to execute the test can be found on Github.
For each browser, a minimum of 16 iterations were recorded, and the average between all iterations reported. Iterations for each browser were approximately spread between all four devices to ensure fair comparisons.
Measuring power
Power was measured on the Surface Book because it has integrated hardware instrumentation that's able to measure the real power consumption of the CPU, GPU and Wifi antenna while the automation is being executed. This is done using the Maxim 34407 Power Accumulator chip. The results of the Maxim chips were read using the tool "Windows Performance Recorder". Windows Performance Recorder was configured to independently measure the instantaneous power consumption of the CPU, GPU, and Wifi antenna, and record periodic measurements in a trace file.
Results details
| Avg CPU | Avg GPU | Avg Wifi | Avg CPU+GPU+Wifi | |
| Microsoft Edge | 1383 | 368 | 106 | 1857 |
| Chrome 57 | 1924 | 571 | 185 | 2680 |
| Firefox 52 | 2572 | 542 | 192 | 3306 |