Browser efficiency comparison - Webdriver
Windows 10 Anniversary Update
Methodology summary
The Microsoft Windows team measured the average power consumption of the CPU, GPU, and Wifi antenna while Microsoft Edge, Chrome, Firefox, and Opera ran a complex yet representative set of user activities.
These tests were done on three Surface Books running Windows 10 Anniversary Update (build 14393.105) and connected to the Internet through Wifi. Actual power consumption of the CPU, GPU, and Wifi antenna were measured using onboard Maxim chips, and read through Performance Monitor (Perfmon).
Results summary
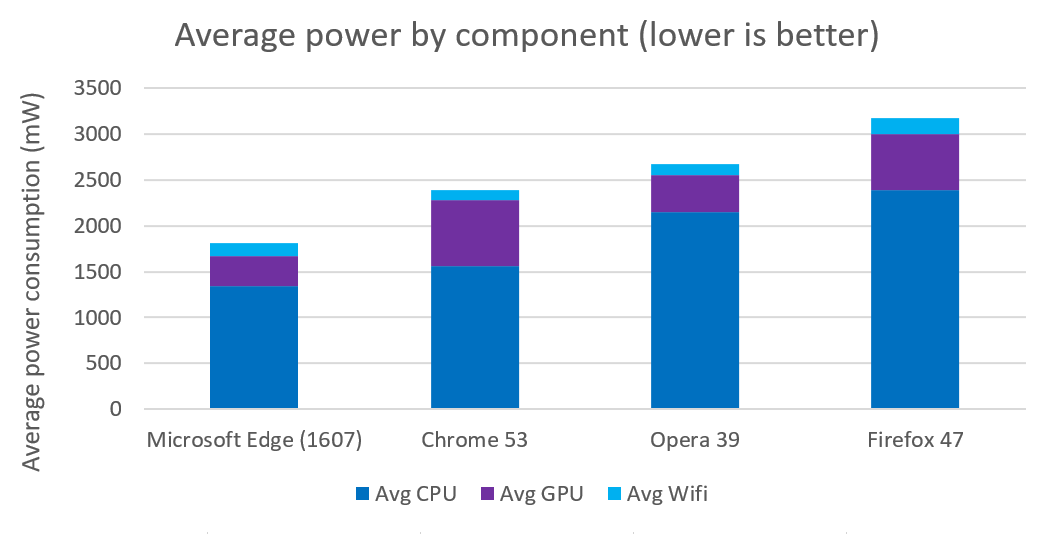
The CPU, GPU, and Wifi antenna all used more power on the same workload when it was run using Chrome, Firefox, and Opera, when compared to Microsoft Edge, running on Windows 10 Anniversary Update (14393.105). Microsoft Edge used:
- 24% less power than Chrome
- 32% less power than Opera
- 43% less power than Firefox
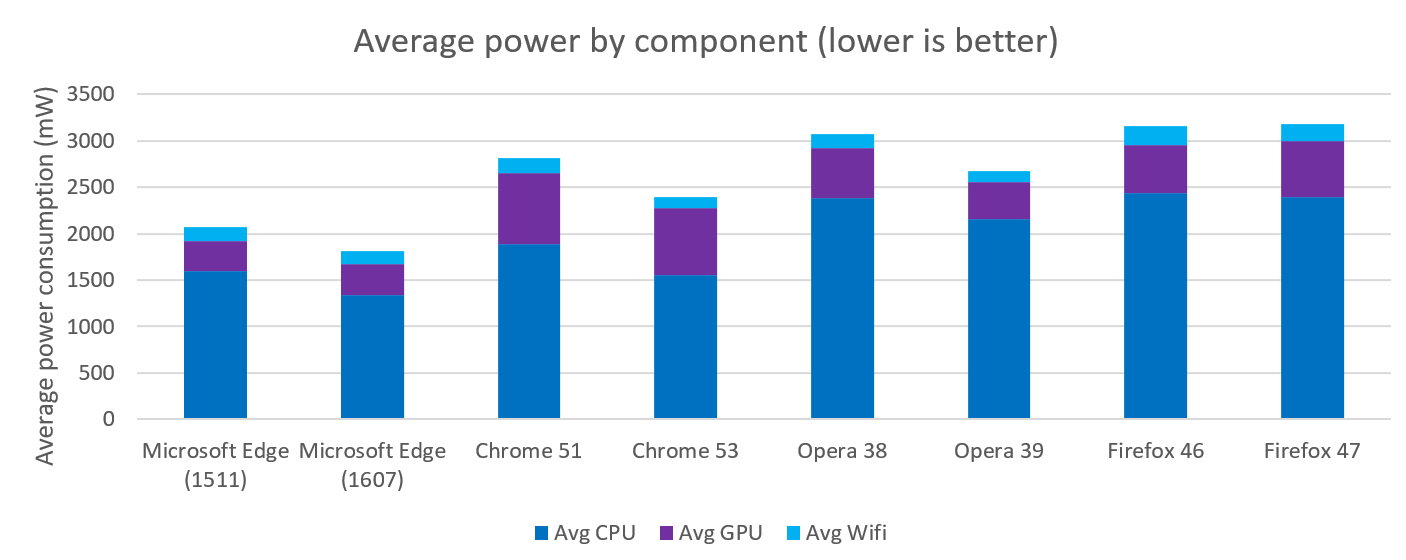
Edge, Chrome, and Opera had a lower mean power consumption when comparing the Anniversary Update (1607) to the previous release (1511) whereas Firefox had virtually no change. In the following graph, we also show Microsoft Edge (1511), Chrome 51, Opera 38, and Firefox 46 running on Windows 10 (1511). Those results are from our previous analysis. Here, we see the improvements made between the updated OS and the updated browsers since then.
Methodology details
Computer setup
The test was performed on 3 separate Surface Book laptops running Windows 10 Anniversary Update (14393.105 release). These computers were configured to the following settings, to increase consistency between measures and reduce tasks that may start during the measurement and interfere with the results, while still representing a realistic user setup:
- Display brightness was set to 50%
- Location was disabled
- Bluetooth was disabled
- Device was connected to a wireless network
- Defender cache was completely built
- Defragmentation was temporarily disabled
- Ambient light sensor was temporarily disabled
- All queued Ngen complication jobs were completed
- Windows update was temporarily disabled
- "New network found" prompts were disabled
- Windows Error Reporting was temporarily disabled
- Queued idle tasks were forced to complete
- Defender was running normally and up to date
- Device was physically unplugged and running on battery
- Volume was muted
- Windows Battery Saver mode was set to activate at 20% battery
- Bitlocker was disabled
- The cache was cleared on each browser
OS and browser versions
| OS | Windows 10 Pro 14393.105 rs1_release |
| Microsoft Edge | Microsoft Edge 38.14393.0.0 |
| Chrome | Google Chrome 53.0.2785.101 m (64-bit) |
| Firefox | Firefox 47.0.1 |
| Opera | Opera 39.0.2256.71 (battery saver enabled) |
Firefox was not run on the most recent version because of a known limitation in Firefox 48.
Hardware
The specifications for the Surface Books were:
- Processor: i5-6300U @ 2.4GHz 2.5GHz
- Memory: 8G
- Intel HD Graphics 520
Activites and automation harness
Each browser was automated using WebDriver, a cross-platform tool designed for automating web browsing, and implemented by the major browsers. While the power draw was being measured, Webdriver executed the following activities:
Note that pauses are included throughout this workload, but are not included in this description for simplicity. Each scenario (one domain in one tab) lasts about a minute before the next tab is opened, though it varies by scenario.
- Open the respective browser
- Navigate to a video on Youtube.com: "Microsoft Design: Connecting Makers"
- The video will autoplay and will continue in a background tab for the remainder of the test
- Open a new tab
- In the new tab, navigate to amazon.com
- In the search box, enter "Game of Thrones" and press enter
- Click on "Game of Thrones Season 1"
- Scroll down to the reviews
- Open a new tab
- In the new tab, navigate to Facebook.com
- Log in to Facebook
- Scroll through the feed on Facebook
- Open a new tab
- In the new tab, navigate to google.com
- Search for "Seattle"
- Open a new tab
- In the new tab, navigate to gmail.com
- Log in to Gmail
- Open and then close several messages in the inbox
- Open a new tab
- In the new tab, navigate to the Wikipedia article on "United States"
- Scroll through the article
- Close the browser
The code used to execute the test can be found on Github.
Measuring power
Power was measured on the Surface Book because it has integrated hardware instrumentation that's able to measure the real power consumption of the CPU, GPU and Wifi antenna while the automation is being executed. This is done using the Maxim 34407 Power Accumulator chip. The results of the Maxim chips were read using the built in Windows tool "Performance Monitor". Performance Monitor was opened and configured to measure each component independently:
- \Energy Meter (CPU_CORES)\Power
- \Energy Meter (GPU_TOP)\Power
- \Energy Meter (WLAN_BT)\Power
It was set to measure for a max duration of 1000s, recording once per second.
For each browser and for each device, 3 iterations on TH2 and 5 iterations on RS1 were measured through the following steps:
- Clear measurements from Performance Monitor
- Start measurements in Performance Monitor
- Immediately execute the WebDriver automation for the browser being measured
- Wait for the automation to complete (steps described above)
- Once automation completes and the browser closes, immediately pause the measurements in Performance Monitor
- Record the average power consumption for each of the three instrumented components
Results details
The following results combine the data collected in the previous analysis (on 1511 with browsers that were up to date at the time) with recent results on the Anniversary Update (1607) and newer browsers. These results are in mW:
| OS | Avg CPU | Avg GPU | Avg Wifi | Avg CPU+GPU+Wifi | |
| Edge 1511 | 1511 | 1599 | 319 | 150 | 2068 |
| Edge 1607 | 1607 | 1340 | 330 | 141 | 1811 |
| Chrome 51 | 1511 | 1889 | 767 | 163 | 2819 |
| Chrome 53 | 1607 | 1559 | 720 | 116 | 2395 |
| Opera 38 | 1511 | 2381 | 543 | 152 | 3077 |
| Opera 39 | 1607 | 2153 | 400 | 124 | 2678 |
| Firefox 46 | 1511 | 2434 | 525 | 202 | 3161 |
| Firefox 47 | 1607 | 2395 | 602 | 179 | 3176 |