Guest Blog Post - Memory corruption vulnerabilities in Edge
Introduction
Memory corruption issues in the browser process are typically some of the most severe issues in Chromium and browsers that are based off it. Such issues can include use-after-free (UAF) problems, as well as out-of-bounds (OOB) reads and out-of-bounds writes. This post describes a number of memory corruption issues that I found in Edge, along with some notes about how I found the issues and some of the common patterns between them. I also give an example of how you can investigate and determine the root cause of a UAF in Edge.
Note that this post assumes the reader has some level of knowledge of both browser internals (e.g. what the browser process is and how it differs from renderer processes) and C++ (e.g. what a unique_ptr is and how it would be used).
Edge Vulnerability Research Team's Response
UAF when selecting custom icon for web app
In Edge, you can select a custom icon when installing a web app. That is, if you open the app menu and then select Apps > Install this site as an app, the dialog that’s shown allows you to select a custom icon.
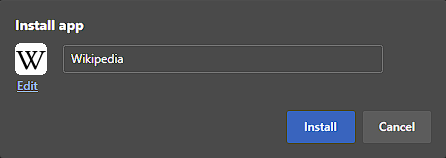
When you click the “Edit” link shown in the install dialog, a file selection dialog will be shown, from which you can then choose a custom icon.
In a previous version of Edge, a UAF would occur if the web app install dialog was closed after the file selection dialog was opened, but before a file was selected.
This issue is a classic lifetime bug. The code that was being run when you selected a file implicitly assumed that the web app install dialog would still exist at that point, but that wouldn’t necessarily be the case. If the tab was navigated elsewhere, the dialog would be closed. The dialog would also be closed if the tab was closed. Either of those things could occur while the file selection dialog was being shown.
I think this issue is a good example of how lifetime bugs tend to manifest and therefore, what to look for, as a bug hunter. Any sort of asynchronous process introduces some risk of potential lifetime issues. Here, the select file dialog is shown asynchronously (off of the browser’s main UI thread), which means that you can still interact with the browser while it’s being shown. That then allows the install dialog to potentially be closed while the file selection dialog is being shown.
This issue was rewarded $30,000 USD.
OOB read when capturing a read: page
When looking for vulnerabilities in Chromium forks, a good place to look is in functionality that is specific to the fork. Whilst forks can make alterations to existing code, it can be hard to know what’s changed (particularly without source code access), making it easier to find issues in completely new features that have been added.
The issue here was in such a feature - specifically, in the web capture functionality that Edge offers.
The issue was that attempting to capture a read: page would trigger an OOB read in certain cases.
Edge uses the read: scheme with its reader mode. If you load a page for which reader mode is available (e.g. https://techcommunity.microsoft.com/t5/discussions/dev-channel-update-to-95-0-997-1-is-live/m-p/2704057) and switch to it (using F9), you’ll see that the read: scheme is used.
If you open the DevTools on a reader mode page, you’ll find that the actual page content is contained within an iframe.
When you then perform a web capture, the code performing the capture has a special case for read: pages. Specifically, the capture code will capture the contents of the iframe. That’s done by iterating through the frames on the page. In a previous version of Edge, there was no check to see whether the end of the frames vector had been reached.
Therefore, if you loaded a read: page that only had a single frame, an OOB read would occur when attempting to capture it.
An example of a read: page with a single frame would be an invalid read: page (e.g. read://_/?url=), since it’s really just an error page. Another example would be a view-source:read:… page.
I found this issue simply by experimenting with the web capture functionality on different types of pages.
This issue was rewarded $30,000 USD.
UAF after showing guided switch dialog
This represents another example of looking at a completely new feature in Edge.
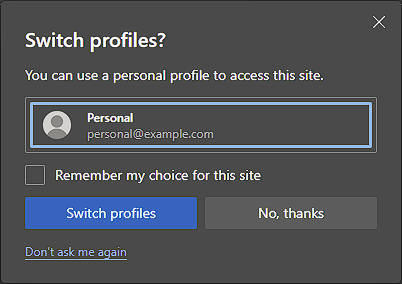
The guided switch dialog is shown when a different profile can be used to login to the target site. For example, if you’re logged into the browser in one profile, but not in a second profile, the guided switch dialog will be shown when loading https://login.live.com/ in the second profile.
The issue here is that the dialog would call BrowserList::AddObserver on creation, however, if the tab hosting the dialog was moved to another window and the original window was closed, the dialog wouldn’t call BrowserList::RemoveObserver on destruction.
Then, if a BrowserList event was dispatched (e.g. because a browser window was created or closed), a UAF would occur.
It’s worth mentioning here that BrowserList::AddObserver should always be matched with a call to BrowserList::RemoveObserver, so if you find a case where the two aren’t matched, it’s likely problematic. Note that I say likely and not certain here because an object that exists for the lifetime of the browser may call BrowserList::AddObserver on creation, but never call BrowserList::RemoveObserver. That wouldn’t be a problem, though, since the object wouldn’t be destroyed until the browser was closed.
This issue was rewarded $30,000 USD.
UAF when interacting with mini menu
The mini menu shown when selecting some text is another feature that’s specific to Edge.

Finding the issue was straightforward. For any browser UI element you might have, there are potential lifetime issues. For example, a dialog might refer to the WebContents (i.e. tab) it’s opened on and a key question is then whether the dialog can outlive the tab. If it can, that may lead to a UAF. The same sorts of issues apply to menus and bubble views (dialog like elements that are shown in the browser).
A menu that’s tab-specific that’s not closed when the tab is closed is immediately suspect. Therefore, finding this issue was just a matter of checking whether the menu was closed when the tab was closed. In a previous version of Edge, it wasn’t, which lead to a UAF if one of the menu items was then selected.
This issue was rewarded $5,000 USD.
OOB read in group editor bubble
Vertical tabs are another Edge-specific feature. If you turn on vertical tabs in a window, then group a tab, you’ll notice that there’s a three dot button shown in the tab strip. If you click that button, the group editor bubble will be shown.

Following on from the last issue, an immediate question here is what happens if the group is deleted (by an extension) while the bubble is being shown? In a previous version of Edge, the bubble would continue to be shown, leading to an OOB read when selecting one of the menu items in the bubble.
This issue is very similar to issue 1228557 in the Chromium project.
This issue was rewarded $30,000 USD.
Edge Vulnerability Research Team's Response
In the original report for this issue, David brought up a great point for remediating this bug:
Aside from ensuring that the bubble is destroyed when the group is destroyed, future issues in this area could also be prevented by changing the DHCECK in TabGroupModel::GetTabGroup to a CHECK:
While this wasn't the direction the development team took, mainly to avoid unnecessarily forking of upstream code, it did give the VR team the push to look for other issues that involved the dereferencing of an out of bounds iterator.
One method the team used to do this was through the amazing tool weggli.
For those that are not familiar weggli is a fast semantic search tool built upon the AST parsing library tree-sitter.
Weggli offered a very succinct way to express different patterns in the code that could indicate problems. An example of one such query would be the one below.
weggli -X -R find=find -R end=end '{ $x = std::$find(_); NOT: _($x == $end()); NOT: _($x != $end()); _(*$x); }'
The above query looks for code that dereferences the result of a function named std::*find* without first comparing it to the result of any method containing the string "end". This isn't the only query we explored as there are many other functions that return iterators, and as indicated in David's comment there could be a comparison for end() but enclosed in a DCHECK. While writing this post we actually ran this query again and found a fixed upstream issue in Edge that failed to merge into our forked code!
When using weggli, similar to other tools such as CodeQL, we aren't looking for a silver-bullet that only identifies vulnerabilities, but simply want to find starting points for research and verification.
OOB read when dragging link over tab strip
This issue is interesting, in that it’s essentially the same as issue 1209616 in the Chromium project. That is, when a window is closed, there’s a brief period where the window still exists, but contains no tabs. In a previous version of Edge, an OOB read could occur if a link was being dragged over the tab strip at that time.
The Chromium issue was fixed by updating TabStrip::GetDropBounds to check whether the tab strip is empty. In Edge, the EdgeTabStrip class inherits from TabStrip and EdgeTabStrip::GetDropBounds overrides TabStrip::GetDropBounds. That means that although the issue was fixed in Chromium, the issue remained present in Edge.
This demonstrates how it can be worthwhile to check whether issues that have been fixed in Chromium still reproduce in Edge. I think it’s also an illustration of how changing the core Chromium code (whether directly or indirectly) in a fork can mean that security fixes in the Chromium project don’t have the intended effect in the forked project.
This issue was rewarded $30,000 USD.
UAF when closing web app install dialog
As described in the first issue above, the web app install dialog allows a custom icon to be chosen. One thing I noticed when selecting a custom icon file is that there’s a bit of delay between selecting the file and having the preview be shown in the dialog. A natural question then is what happens if the dialog is closed before the icon preview is updated (i.e. immediately after a file is selected)?
In a previous version of Edge, a UAF would occur, due to the fact that the object that was processing the image on a background thread would be destroyed (in the middle of the processing operation) when the dialog was closed.
This again illustrates how an asynchronous process can lead to lifetime issues.
This issue was rewarded $30,000 USD.
Edge Vulnerability Research Team's Response
Here David has honed in on a very common bug pattern that we have spent a lot of effort in education and tooling to try to combat. Internally, UAFs stemming from a mismatch of object lifetimes and threads using those objects account for a large number of the findings by the security team.
For this particular issue, the code that caused it looks very similar to the below example code.
1
      2
      3
      4
      5
      6
      7
      8
      9
      base::ThreadPool::PostTaskAndReply(
         FROM_HERE,
         {base::MayBlock(), base::TaskPriority::BEST_EFFORT,
            base::TaskShutdownBehavior::SKIP_ON_SHUTDOWN},
         base::BindOnce(
               base::IgnoreResult(&MyClass::Method),
               base::Unretained(this), parameter),
         base::BindOnce(&MyClass::Callback,
                        weak_ptr_factory_.GetWeakPtr()));
In the above code, you can see that a task executing MyClass::Method is scheduled to run on a background thread. When MyClass::Method completes, MyClass::Callback will be scheduled to execute on the sequence that originally called PostTaskAndReply. The this value for MyClass is bound as a parameter so that when MyClass::Method executes it uses the instance of MyClass. The base::Unretained indicates this will be a raw pointer and will not be reference counted. Unlike the call to MyClass::Method, the first parameter of MyClass::Callback is instead a weak pointer. This difference causes Edge to check if the instance of MyClass is still alive before it attempts to execute Callback. If MyClass is destroyed on the same sequence that MyClass::Callback is scheduled, then we can be sure that when MyClass::Callback begins executing the object is still alive and will remain alive for the entire time it is running.
In this case the bug, was exactly as David mentioned. The instance of MyClass could be destroyed while running in this background thread. Many times we have seen developers believe a fix to issues like this is to convert the base::Unretained(this) into a weak_ptr_factory_.GetWeakPtr() call. However, this is incorrect as that would only prevent the task from being run if the object was not already destroyed. This means as soon as the task is running all bets are off and there will be a race.
Luckily, these types of issues are fairly easy to audit for statically and dynamically. I will list them from least complex to most complex.
Grep
KISS, keep it simple stupid, can be a good way to approach problems like these. Just having a dashboard with all newly added PostTask calls is surprisingly a viable technique for identifying these types of problems on commit. The cognitive load with this technique is fairly high, but it usually only takes a couple seconds to verify if a PostTask call could lead to a problem. It's a nice ritual to add while having my coffee in the morning. A downside to this is it really only helps audit new code and not identifying code already in the code base. It is also rather fragile to a person changing the parameters of an already existing PostTask call.
Clang AST Matchers
Despite the heading of the chromium documentation for writing clang plugins being "Don't write a clang plugin", they can be rather useful. In the above example, the core issue is passing a reference to this for use on another thread. While it can be tricky to identify the PostTask call itself, identifying these unsafe binds is trivial with a matcher plugin. With this technique, we can accurately identify base::BindOnce and base::BindRepeating calls that store pointers or even weak pointers to these unsafe types and use them to target code review. One benefit to this technique is it can be quite fast as it is trivial to run on only files that have been recently changed.
CodeQL
Similar to the previous technique, another method of identifying these unsafe threading calls is targeting the base::Bind* calls with CodeQL. However, unlike when using a matcher you can use CodeQL to find sinks where the closure created by the bind is used. The folks at GitHub have created an amazing pack of CodeQL scripts that can be used out of the box or as a starting point.
Instrumentation
This technique is potentially more complex, but depending on how you implement it can be applied at build-time or at runtime. The idea behind this technique would be pinning memory access for certain object types to specific threads. For example, it is nearly ALWAYS a UAF if a pointer to a WebContents object and many other object types to be dereferenced from any thread but the UI thread. With this in mind, we can use use Clang or hooking at runtime to instrument memory accesses to these classes of objects and alert us of potential issues.
UAF when closing JavaScript dialog
In a previous version of Edge, F6 would cycle focus not just between core UI elements in the browser window (e.g. the tab strip and address bar), but also any JavaScript dialog. That is, F6 could also shift focus to the dialog itself.
Internally, to support this, the dialog would call BrowserView::SetFocusDialog on creation and BrowserView::RemoveFocusDialog on destruction.
However, if the dialog was moved to another browser window, the original window closed, and the dialog then closed, the call to BrowserView::RemoveFocusDialog would trigger a UAF, as it would attempt to make a call on the original BrowserView.
I think this illustrates how dialogs can be a good place to look for vulnerabilities. There are essentially two types of dialogs:
- Browser modal dialogs. These dialogs are tied to a browser window.
- Tab modal dialogs. These dialogs are tied to a tab.
This creates a few places for potential security issues:
- A browser modal dialog that refers to a particular
WebContents(i.e. tab) is likely wrong, since the tab can be closed without closing the dialog. - A tab modal dialog that refers to a particular
Browserinstance (or anything associated with thatBrowser, such as theBrowserView) is likely wrong, since the tab and dialog can be moved to another browser window and the original browser window closed. - Any dialog that refers to data that an extension/web page can modify or delete is problematic, precisely because the extension/web page can modify data while the dialog is being shown. An example of this can be seen in issue 1161144 in the Chromium project.
This issue was rewarded $30,000 USD.
Verifying a memory corruption issue in Edge
With each of the issues above, I typically observed a browser crash after performing a series of steps. A question that immediately comes up after observing such a crash is whether the crash is due to a memory corruption issue.
While a crash that refers to a valid-looking memory address is a dead giveaway that a memory corruption issue is involved, that’s not always what happens. I’ve encountered quite a few UAFs, for example, that tend to crash the browser with a reference to a near-NULL address. There’s then a need to distinguish between a memory corruption issue and a harmless NULL pointer dereference.
When verifying a potential memory corruption issue in Chromium, the problem is often trivial. There are AddressSanitizer (ASan) builds available for Chromium. Typically, all you need to do is download one of those builds, reproduce the issue in it, and check the output that it gives you.
However, there are no ASan builds available for Edge. Verifying that a crash in Edge is being caused by an exploitable memory issue is possible, but more work then when you have an ASan build available.
There are different ways of going about the process of verifying the cause of a crash, but I rely on two specific tools, along with the debugging symbols that Microsoft provide:
Ghidra allows the binary code that comprises the browser to be decompiled and turned back into an approximate version of the original code.
WinDbg lets you debug the browser as it’s running.
Taken together, these two tools make it reasonably easy to step through the code as it’s running and gain a high-level understanding of what’s happening.
What follows here is an illustration of how you can use these tools to investigate a potential security issue, with the first UAF described above used as an example.
Ghidra setup
- Download Ghidra.
- In Ghidra, create a new project and import msedge.dll (found in C:\Program Files (x86)\Microsoft\Edge\Application\{version}).
- Open msedge.dll in the CodeBrowser tool. When asked if you would like to analyze msedge.dll, select “No”.
- Load the PDB for msedge.dll, by selecting File > Load PDB File… Ensure that you have a local symbol storage path configured and that you’ve added the Microsoft symbol server (
https://msdl.microsoft.com/download/symbols) as a search path. - Once you’ve loaded the PDB file, Ghidra will process it, before performing an auto analysis of msedge.dll. Expect this process to take a while - at least several hours. Once the auto analysis has finished, you can then browse through the decompiled code generated from msedge.dll.
WinDbg setup
There’s not much setup required for WinDbg. Ensure that you have the Microsoft symbol server included in the symbol server settings and then attach WinDbg to the Edge browser process.
Investigating an issue - an example
Once you have Ghidra and WinDbg set up, you can then investigate an issue.
Below is a demonstration of how I investigated the first issue described above. Note that the investigation is based on an older version of msedge.dll and its corresponding symbol file. As Microsoft only provide symbols for the current version of msedge.dll, you won’t be able to reproduce the demonstration here exactly, but the process of investigating an issue is what’s important (since it doesn’t tend to change much from one issue to another).
Having observed a crash when selecting a custom icon file, the first thing to do is to examine the crash dump. Doing so gives the following stack trace (only the last few relevant entries are shown):
1
2
3
4
5
msedge.dll!WebAppCustomIconFile::~WebAppCustomIconFile()
msedge.dll!EdgeWebAppCustomIcon::OnEditIconButtonPressed()
msedge.dll!base::internal::Invoker<base::internal::BindState<`lambda at ../../ui/views/controls/button/button.cc:115:31',base::RepeatingCallback<void ()>>,void (const ui::Event &)>::Run()
msedge.dll!views::Link::OnMouseReleased(class ui::MouseEvent const &)
...
As can be seen, the crash occurred within EdgeWebAppCustomIcon::OnEditIconButtonPressed. Often (though not always), the crash dump will give a starting point for any investigation.
The next logical step is to look at the EdgeWebAppCustomIcon class in Ghidra.
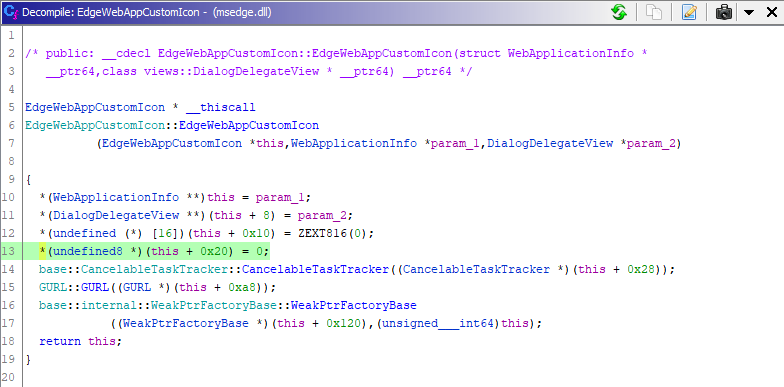
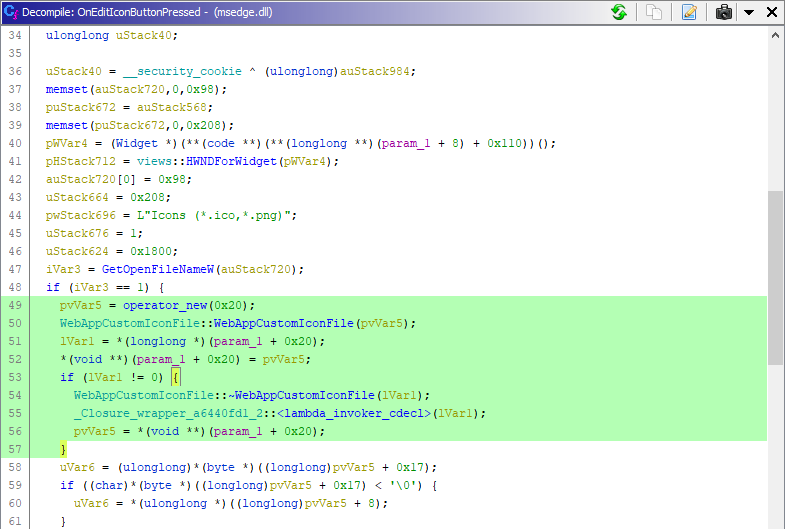
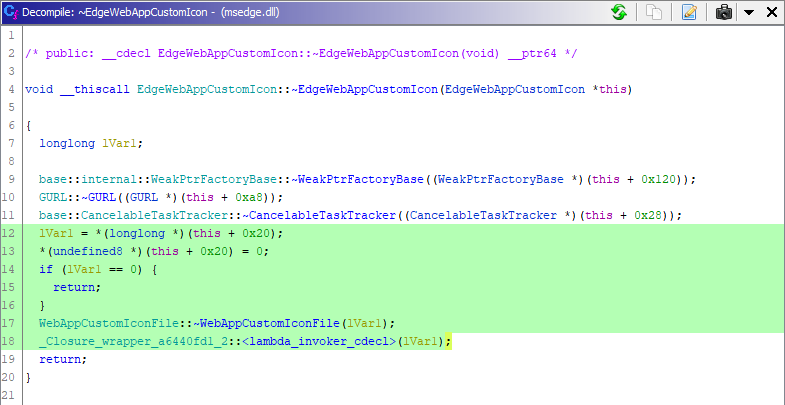
As can be seen in the screenshots above, EdgeWebAppCustomIcon holds an instance of WebAppCustomIconFile in a member variable (likely as a unique_ptr).
- The value is initialized to
NULLin the constructor. - The instance member is set in
EdgeWebAppCustomIcon::OnEditIconButtonPressedand any previous instance is destroyed. - The instance is also destroyed (when appropriate) in the destructor.
Based on that, it appears that the EdgeWebAppCustomIcon class has ownership of the WebAppCustomIconFile instance and is responsible for managing its lifetime. Therefore, if the WebAppCustomIconFile instance being destroyed isn’t valid, the EdgeWebAppCustomIcon instance likely isn’t either.
The next step is to check how the EdgeWebAppCustomIcon instance is created and how it’s destroyed. While Ghidra can be used to for that purpose (e.g. by searching for references to EdgeWebAppCustomIcon::EdgeWebAppCustomIcon and EdgeWebAppCustomIcon::~EdgeWebAppCustomIcon), I think WinDbg tends to be the better option here, since there can be multiple callers, or the caller may not be shown by Ghidra (depending on exactly how the call is made).
When attached to the browser in WinDbg, the following command can be used to set a breakpoint on the EdgeWebAppCustomIcon constructor:
bu msedge!EdgeWebAppCustomIcon::EdgeWebAppCustomIcon
Similarly, the command below can be used to set a breakpoint on the EdgeWebAppCustomIcon destructor:
bu msedge!EdgeWebAppCustomIcon::~EdgeWebAppCustomIcon
Running the browser with these breakpoints set then shows that the EdgeWebAppCustomIcon instance is being created in the following way:
1
2
3
4
msedge!EdgeWebAppCustomIcon::EdgeWebAppCustomIcon
msedge!WebAppConfirmationView::WebAppConfirmationView
msedge!chrome::EdgeShowSiteDialog
...
While it’s being destroyed in the following way:
1
2
3
4
5
6
7
msedge!EdgeWebAppCustomIcon::~EdgeWebAppCustomIcon
msedge!WebAppConfirmationView::~WebAppConfirmationView
msedge!WebAppConfirmationView::`scalar deleting destructor'
msedge!views::WidgetDelegate::DeleteDelegate
msedge!views::Widget::OnNativeWidgetDestroyed
msedge!views::NativeWidgetAura::OnWindowDestroyed
...
Looking at the WebAppConfirmationView class in Ghidra shows that the EdgeWebAppCustomIcon instance is being stored in a member variable (again, likely as a unique_ptr).


To summarize:
WebAppConfirmationViewis the view associated with the web app install dialog.WebAppConfirmationViewholds an instance ofEdgeWebAppCustomIconin a member variable. WhenWebAppConfirmationViewis destroyed,EdgeWebAppCustomIconis destroyed as well.WebAppConfirmationViewis destroyed when the web app install dialog is closed. That can happen when the tab is navigated elsewhere or closed.
Therefore, in the original scenario given above, the following occurs:
- The user opens the web app install dialog on a tab. An instance of the
WebAppConfirmationViewclass is created, which then creates an instance ofEdgeWebAppCustomIconand stores it in a member variable. - The user then clicks the “Edit” link in the install dialog, which results in a file selection dialog being shown.
- The tab is then navigated to a different location or closed (by the page itself or by an extension). This results in the dialog being closed and both the
WebAppConfirmationViewandEdgeWebAppCustomIconinstances being destroyed. - The user chooses a file from the file selection dialog, which causes
EdgeWebAppCustomIcon::OnEditIconButtonPressedto access members of the class. However, theEdgeWebAppCustomIconinstance has already been destroyed, so that results in a UAF.
As a side note, when verifying a UAF, it can also be useful to see that the memory being accessed was the memory that was freed. WinDbg allows you to place data breakpoints, which can be used for that purpose.
For example, in the case above, you might observe the creation of the EdgeWebAppCustomIcon instance and place a data breakpoint on its address (the command below assumes that the address is 4fe400c5bf00):
ba w8 4fe400c5bf00
That breakpoint should then be hit when the instance is freed. You can then verify that EdgeWebAppCustomIcon::OnEditIconButtonPressed is trying to access memory within that block.
Another very useful feature offered by WinDbg preview is time travel debugging. I mentioned above that a crash dump may not always give you much information. Because a crash dump only gives you information about where the crash occurred, it’s not necessarily helpful when figuring out the cause of a crash.
For example, if there’s an object that’s used from many different places and can be allocated in various ways, a UAF involving that object might cause a crash in a variety of locations (depending on whatever happens to try to access the object first). A crash dump won’t be terribly useful in that sort of situation, since although it will probably show what object is involved, it won’t show where it was allocated.
Time travel debugging coupled with data breakpoints can be a very powerful tool in debugging those sorts of crashes. Although I didn’t need time travel debugging for any of the issues listed here, I did use it to investigate some more recent issues and it was essential in those cases. So, if you’re using WinDbg to investigate an issue you’ve found, it’s something to keep in mind.
Conclusion
As demonstrated by the issues described above, there are a few patterns that can be used to find vulnerabilities. Any asynchronous process introduces the possibility of lifetime issues. Doing same basic tests of such a process (e.g. testing what happens when you close a tab/window/the browser while the process is ongoing) can reveal issues.
Dialogs also present a good opportunity to find lifetime issues, given that the lifetime of a dialog may be independent of the lifetime of the resources that it references.
Looking for issues in functionality that has specifically been added to Edge can also be a good step to take. You can find such functionality by experimenting within the browser, reading through the documentation for Edge, browsing through the decompiled code in Ghidra, or by looking through the information Microsoft publishes for what’s new in the browser.
In terms of investigating and determining the root cause of an issue when the source code isn’t available, Ghidra and WinDbg are invaluable. Whilst I only described the process of investigating the first issue above, I used both Ghidra and WinDbg to investigate each of the issues here.
Although it can be time consuming to determine the cause of an issue, it’s helpful both because it means the browser developers don’t have to spend too much time investigating and because knowing how the browser works, in specific detail, can make it significantly easier to find further issues.
In total, the issues described here were rewarded $215,000 USD by Microsoft, illustrating how valuable it can be to find and report memory corruption issues to the browser vendors.
Edge Vulnerability Research Team's Response
The Edge Vulnerability Research Team owns the triage process for all MSRC cases involving Microsoft Edge, and we strive to make quick and fair assessments on the impact of vulnerabilities and adequately compensate researchers that take the time to hunt for bugs. On the topic of compensation, it is worth noting that the Edge team aligns itself very closely with the severity guidelines of Chromium and due to recent changes in the upstream policy, in regards to user interaction, some of these issues if reported today may not be paid out at the same amount.
In closing, the security team greatly appreciates David's reports, and with David sharing some of his processes, we hope we get even more external reports and can continue to keep our users secure.