MSEdgeExplainers
Explainer: Delayed Message Timing API
Author: Joone Hur
Status of this Document
This document is intended as a starting point for engaging the community and standards bodies in developing collaborative solutions fit for standardization. As the solutions to problems described in this document progress along the standards-track, we will retain this document as an archive and use this section to keep the community up-to-date with the most current standards venue and content location of future work and discussions.
- This document status: ARCHIVED
- Current venue: W3C Web Incubator Community Group | WICG/eyedropper-api |
- Current version: Delayed Message Timing API Explainer

Participate
Table of Contents
- Overview
- Goals
- Non-goals
- Problems
- Proposal: Introducing the Delayed Message Timing API
PerformanceDelayedMessageTimingInterfacepostMessageTimestamps and Durations:- Instance Properties
PerformanceEntry.entryTypePerformanceEntry.namePerformanceEntry.startTimePerformanceEntry.durationPerformanceDelayedMessageTiming.sentTimePerformanceDelayedMessageTiming.processingStartPerformanceDelayedMessageTiming.processingEndPerformanceDelayedMessageTiming.blockedDurationPerformanceDelayedMessageTiming.serializationPerformanceDelayedMessageTiming.deserializationPerformanceDelayedMessageTiming.taskCountPerformanceDelayedMessageTiming.scriptTaskCountPerformanceDelayedMessageTiming.totalScriptDurationPerformanceDelayedMessageTiming.messageTypePerformanceDelayedMessageTiming.traceIdPerformanceDelayedMessageTiming.invokerPerformanceDelayedMessageTiming.receiverPerformanceDelayedMessageTiming.scripts
PerformanceMessageScriptInfoInterface- Instance Properties
PerformanceMessageScriptInfo.namePerformanceMessageScriptInfo.sourceFunctionNamePerformanceMessageScriptInfo.sourceURLPerformanceMessageScriptInfo.executionContextPerformanceMessageScriptInfo.sourceCharPositionPerformanceMessageScriptInfo.sourceLineNumberPerformanceMessageScriptInfo.sourceColumnNumber
- Instance Properties
PerformanceExecutionContextInfoInterface- Monitoring Delayed
postMessageEvents - Examples of a
delayed-messagePerformance Entry
- Alternatives Considered
- Security and Privacy Considerations
- Discussion
- Related Discussion, Articles, and Browser Issues
- Acknowledgements
- References
Overview
Web applications frequently use the postMessage API for communication across different execution contexts, such as between windows, iframes, and web workers. However, message delays often occur when messages are queued but not processed promptly.
These delays can degrade the user experience by making applications feel unresponsive. While developers can detect that a delay happened, identifying the specific cause—whether it's a busy thread, a congested task queue, or serialization/deserialization overhead—is challenging with current tools.
The Delayed Message Timing API is a proposed Web Performance API that enables developers to diagnose delays in postMessage communication across windows, iframes, and web workers. By exposing end-to-end timing and attribution data including task queue wait time, serialization/deserialization cost, and blocking tasks, this API helps identify bottlenecks that degrade responsiveness in complex web applications.
Goals
- Enable detection of congested contexts: Allow websites to identify specific browser contexts (windows, tabs, iframes) or web workers that are slow to process
MessageEvents. This covers cross-document messaging, cross-worker/document messaging, channel messaging, and broadcast channels. - Provide detailed end-to-end timing: Offer comprehensive timing information for
postMessageevents, including task queue wait time, and the time taken for serialization and deserialization, to help pinpoint bottlenecks. - Identify blocking tasks: Help developers find the specific scripts that prevent
postMessageevents from being handled promptly from the task queue.
Non-goals
This API does not aim to monitor or provide diagnostics for the following types of message communications:
Problems
While developers expect messages sent via postMessage to web workers or iframes to be processed promptly, these tasks typically receive default priority in the browser's task scheduler(e.g. Chromium). As a result, postMessage communication can experience noticeable delays due to lower prioritization compared to user-visible tasks, often compounded by synchronous JavaScript blocking the target thread, a flood of messages overwhelming the task queue, or significant time spent processing the data being transferred, making the root cause challenging to pinpoint.
These problems can be broadly categorized into three areas:
- Thread being occupied: The receiving thread is busy executing long-running tasks.
- Task queue becoming congested: Too many messages or tasks are enqueued faster than they can be processed.
- Serialization/deserialization processes taking significant time: The data being sent is large or complex, leading to overhead.
The following sections will analyze each area with examples. All examples involve web workers, but similar situations can also occur between the main window and iframes, or between different windows.
Case 1: Thread Occupation
The following example code demonstrates how a long-running task on a worker thread can block subsequent messages in its task queue.
index.html
<!DOCTYPE html>
<html lang="en">
<head>
    <meta charset="UTF-8">
    <title>Delayed Messages in Web Workers Caused by Task Overload</title>
</head>
<body>
    <h3>Delayed Messages in Web Workers Caused by Task Overload</h3>
    <button onclick="runWorker()">Start</button>
    <p id="result"></p>
    <script src="main.js"></script>
</body>
</html>
main.js
When the user clicks the "Start" button, the runWorker function dispatches five messages to the worker at 60ms intervals. Each message includes an input number that dictates how long a simulated task should run in the worker.
function runWorker() {
  const worker = new Worker("worker.js", { name: "long_task_worker" });
  let i = 0;
  const interval = 60; // Interval in milliseconds
  const inputArray = [50, 50, 50, 120, 50]; // Durations for tasks in worker

  // Function to send messages to the worker at the specified interval
  function sendMessage() {
    if (i < inputArray.length) {
      const input = inputArray[i];
      // Send a message to the worker
      worker.postMessage({
        no: i+1,
        input: input,
        startTime: performance.now() + performance.timeOrigin, // Absolute time
      });
      i++;
    } else {
      // Stop sending messages.
      clearInterval(messageInterval);
    }
  }

  // Start sending messages every 60ms
  const messageInterval = setInterval(sendMessage, interval);
}
worker.js
The web worker receives messages and simulates a task that runs for the duration specified by e.data.input. If this duration is greater than the message sending interval (60ms), it can block subsequent messages.
// Simulates a task that consumes CPU for a given duration
function runTask(duration) {
  const start = Date.now();
  while (Date.now() - start < duration) { // Use duration directly
    /* Busy wait to simulate work */
  }
}

onmessage = function runLongTaskOnWorker(e) {
  const processingStart = e.timeStamp; // Time when onmessage handler starts
  const taskStartTime = performance.now();

  runTask(e.data.input); // Simulate the work

  const taskDuration = performance.now() - taskStartTime;
  // Calculate timings relative to worker's performance.timeOrigin
  const startTime = e.data.startTime - performance.timeOrigin;
  const blockedDuration = processingStart - startTime;
};
The following timeline illustrates message handling:
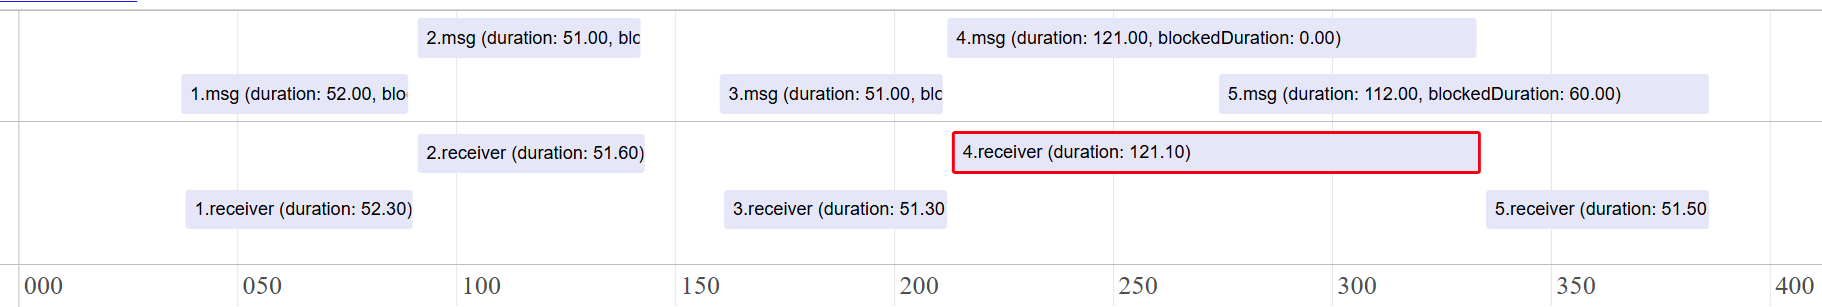
In this timeline, messages #1, #2, and #3 are handled promptly because their simulated tasks (50ms) complete within the 60ms interval at which messages are sent.
However, message #4's task is instructed to run for 120ms. While it's processing, message #5 (sent 60ms after message #4 was sent) arrives at the worker. Message #5 must wait in the worker's task queue until message #4 completes. This results in message #5 experiencing a significant delay (approximately 60ms) before its handler can even begin.
Manually instrumenting code with performance.now() and event.timeStamp can help identify the root cause of delays as shown. However, in complex real-world applications, precisely identifying which long task caused a specific message delay, or distinguishing between delay caused by a preceding long task versus a message's own long handler, is very challenging without comprehensive, dedicated monitoring. This API aims to simplify such diagnoses.
Case 2: Task Queue Congestion
Another challenge is when the target context's task queue becomes overloaded with many short tasks. On the main thread, this often happens when the queue is saturated with high-priority tasks like user interaction and network handling, alongside internal system overhead tasks for navigation, loading, and rendering. In web workers, congestion occurs when a large number of messages are posted in a short period. In both cases, tasks or messages arrive faster than they can be processed, creating a backlog that delays subsequent messages, including those that may be time-sensitive. Although each individual task is not a long task, their combined accumulation causes queue congestion that effectively acts like a single disruptive long task.
This example demonstrates how task queues in web workers can become congested when tasks take longer to process than the rate at which messages are sent. It sends delete tasks every 30ms, then a read task, measuring queue wait times to show the congestion effect.
index.html
<!doctype html>
<html lang="en">
  <head>
    <meta charset="UTF-8" />
    <meta name="viewport" content="width=device-width, initial-scale=1.0" />
    <title>An example of a task queue experiencing congestion</title>
  </head>
  <body>
    <h1>Task Queue Congestion Example</h1>
    <button onclick="sendTasksToWorker()">Start</button>
    <script src="main.js"></script>
  </body>
</html>
main.js
In main.js, the email application sends 10 deleteEmail tasks every 30 ms to clear junk emails, keeping the worker occupied with intensive processing. Shortly after, the user requests to check their emails, requiring an immediate response.
const worker = new Worker("worker.js");

// Counter for generating unique email IDs for each delete task
let emailID = 0;

function sendTasksToWorker() {
  const interval = setInterval(() => {
    // Send delete task with unique email ID and timestamp
    worker.postMessage({
      emailId: emailID,
      taskName: `deleteMail`,
      startTime: performance.now() + performance.timeOrigin, // Absolute timestamp for timing analysis
    });
    console.log(`[main] dispatching the deleteMail task(email ID: #${emailID})`);
    emailID++;
    if (emailID >= 10) {
      clearInterval(interval);
      // Send final read task - this will experience the most queue delay
      worker.postMessage({
        taskName: "checkMails",
        startTime: performance.now() + performance.timeOrigin, // Timestamp when task is queued
      });
      console.log("[main] dispatching the checkMail task");
    }
  }, 30); // 30ms interval creates congestion (faster than worker's 50ms task duration)
}
worker.js
The web worker's onmessage handler processes deleteMail, and checkMails tasks received from the main thread. Each task requires 50ms to complete.
onmessage = async (event) => {
  const processingStart = event.timeStamp; // Time when worker starts processing this message
  const startTimeFromMain = event.data.startTime - performance.timeOrigin; // Convert to worker timeline
  // Calculate task queue wait time by comparing when the message
  // was sent (from main thread) vs when it started processing (in worker)
  const blockedDuration = processingStart - startTimeFromMain;
  const message = event.data;

  if (message.taskName === "checkMails") {
    await checkMails(message, blockedDuration);
  } else if (message.taskName === "deleteMail") {
    await deleteMail(message, blockedDuration);
  }
};

// Check emails from the mail storage
function checkMails(message, blockedDuration) {
  const startRead = performance.now();
  // Simulate task
  const start = Date.now();
  while (Date.now() - start < 50) {
    /* Do nothing */
  }
  const endRead = performance.now();
  console.log(
    `[worker] ${message.taskName},`,
    `blockedDuration: ${blockedDuration.toFixed(2)} ms,`,
    `duration: ${(endRead - startRead).toFixed(2)} ms`,
  );
}

// Delete an email by ID.
async function deleteMail(message, blockedDuration) {
  return new Promise((resolve) => {
    const startDelete = performance.now();
    // Simulate the delete task.
    const start = Date.now();
    while (Date.now() - start < 50) {
      /* Do nothing */
    }
    const endDelete = performance.now();
    console.log(
      `[worker] ${message.taskName}(email ID: ${message.emailId}),`,
      `blockedDuration: ${blockedDuration.toFixed(2)} ms,`,
      `duration: ${(endDelete - startDelete).toFixed(2)} ms`,
    );
    resolve();
  });
}
The following timeline illustrates this congestion:
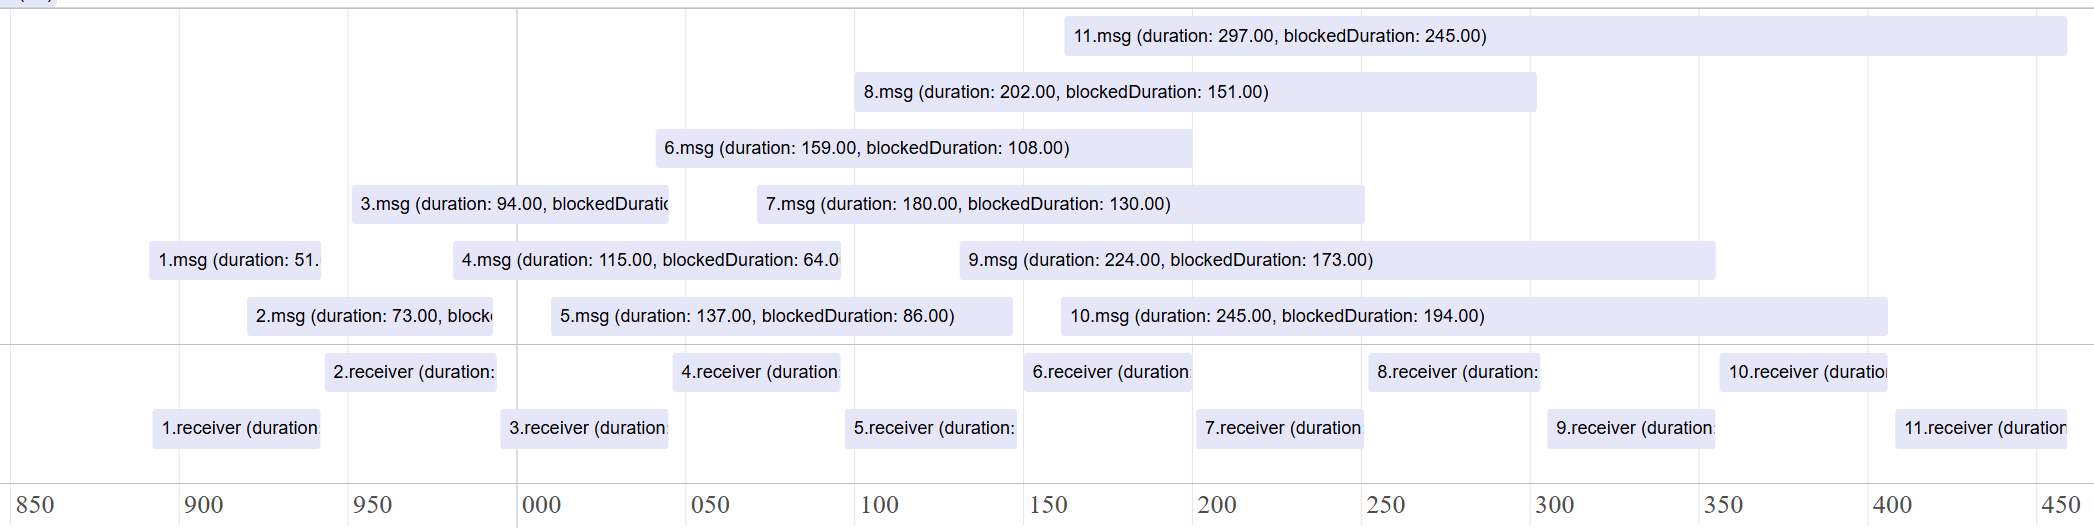
In this scenario, the worker processes 10 deleteMail tasks, each taking 50ms, while being sent every 30ms. This disparity causes tasks to accumulate in the task queue. Consequently, later tasks, like the 11th task checkMails, spend a significant amount of time waiting in the queue (e.g., 245ms) even if their own processing time is short (e.g., 51.5ms).
While delays in background tasks like deleteMail might be acceptable, delays in user-initiated, high-priority tasks like checkMails severely impact user experience. It's important for developers to identify if a browser context or worker is congested and which tasks contribute most to this congestion.
Case 3: Serialization/Deserialization Overhead
When data is sent using postMessage(), it undergoes serialization by the sender and deserialization by the receiver. For large or complex JavaScript objects (e.g., a large JSON payload or a deeply nested object), these processes can consume considerable time, blocking the respective threads.
The following example code demonstrate the delay introduced by serializing/deserializing a large JSON object during postMessage().
index.html
<!doctype html>
<html lang="en">
  <head>
    <meta charset="UTF-8" />
    <title>postMessage Serialization/Deserialization Performance Impact</title>
  </head>
  <body>
    <button id="sendJSON">Send Large JSON (~7MB)</button>
    <script src="main.js"></script>
  </body>
</html>
main.js
In the main.js file, 7000 JSON objects are sent to the worker using postMessage(). The duration of serialization can be measured by calling the performance.now() before and after executing postMessage().
const worker = new Worker("worker.js");

// Generate a large JSON object to demonstrate serialization overhead
function generateLargeJSON(size) {
  const largeArray = [];
  for (let i = 0; i < size; i++) {
    largeArray.push({
      id: i,
      name: `Item ${i}`,
      data: Array(1000).fill("x") // Each item contains ~1KB of string data
    });
  }
  return { items: largeArray }; // Returns ~7MB object when size=7000
}

// Send a large JSON object to the worker to demonstrate serialization overhead
function sendLargeJSON() {
  const largeJSON = generateLargeJSON(7000); // ~7MB of data
  console.log("[main] Dispatching a large JSON object to the worker.");

  // Measure time for postMessage call (includes serialization)
  const startTime = performance.now();
  worker.postMessage({
    receivedData: largeJSON,
    startTime: startTime + performance.timeOrigin,
  });
  const endTime = performance.now();

  // Note: This timing includes serialization but may also include other overhead
  console.log(
    `[main] postMessage call duration (includes serialization): ${(endTime - startTime).toFixed(2)} ms`,
  );
}

// Add event listener to the button
document.getElementById("sendJSON").addEventListener("click", sendLargeJSON);
worker.js
In worker.js, the duration of deserialization is estimated by calling performance.now() immediately before and after the first access to properties of event.data (e.g., event.data.startTime), as this access typically triggers the deserialization process.
// Worker receives large data
onmessage = (event) => {
  const processingStart = event.timeStamp;
  // Measure deserialization time by accessing the large data object
  // Note: Deserialization typically occurs when data is first accessed (implementation-dependent)
  const deserializationStartTime = performance.now();
  const startTimeFromMain = event.data.startTime - performance.timeOrigin;
  const receivedData = event.data.receivedData;
  const deserializationEndTime = performance.now();
  const blockedDuration = processingStart - startTimeFromMain;

  console.log("[worker] Deserialized Data:", receivedData.items.length, "items.");
  console.log(
    "[worker] Deserialization time:",
    (deserializationEndTime - deserializationStartTime).toFixed(2),
    "ms",
  );

  const totalDataProcessingTime = (deserializationEndTime - startTimeFromMain);
  console.log("[worker] blockedDuration (including serialization):", blockedDuration.toFixed(2), "ms");
  console.log("[worker] serialization + deserialization (estimate):", totalDataProcessingTime.toFixed(2), "ms");
Console logs
[main] Dispatching a large JSON object to the worker.
[main] postMessage call duration (~7MB object serialization): 111.20 ms
[worker] Deserialized Data: 7000 items.
[worker] Deserialization time: 454.40 ms
[worker] blockedDuration (including serialization): 111.10 ms
[worker] serialization + deserialization (estimate): 566.00 ms
As shown, serialization on the main thread (approx. 111.20 ms) occurs synchronously during the postMessage() call, blocking other main thread work. Similarly, deserialization on the worker thread (approx. 454.40 ms) is a significant operation that blocks the worker's event loop during message processing, delaying the execution of the onmessage handler and any subsequent tasks.
In this example, the worker log blockedDuration: 111.10 ms indicates the time elapsed from when the main thread initiated the postMessage() (including its 111.20 ms serialization block) to when the worker's onmessage handler began execution. This suggests that the task queue wait time is nearly zero, and the delay is primarily caused by serialization on the sender side. However, the cost of data handling is difficult to estimate because the size of the message payload can vary depending on the scenario.
Another issus is that the timing of deserialization, which the specification suggests should occur before the message event, can vary across browsers. For example, browsers like Chromium may delay this process until the message data is actually accessed for the first time. This inconsistency, combined with a busy event loop that makes it difficult to distinguish serialization, actual queueing, deserialization, and task execution delays even with manual instrumentation, further underscores the need for an API to expose this timing information.
Summary of Problems
Message delays frequently occur and can degrade user experience. While existing tools can detect delays, pinpointing the exact cause is difficult. Delays often stem from the receiver's thread being busy with long tasks, task queue congestion, or serialization/deserialization overhead. Accurately measuring internal task queue wait time is especially challenging with manual instrumentation. A dedicated API is needed to precisely measure, attribute, and identify these specific sources of delay.
Proposal: Introducing the Delayed Message Timing API
The Delayed Message Timing API introduces the PerformanceDelayedMessageTiming interface, delivered via the PerformanceObserver API. This interface allows developers to identify browser contexts or workers where postMessage events are significantly delayed in the task queue. It also provides detailed breakdowns of the event's lifecycle, including information about the invoker, receiver, and blocking scripts.
This new interface relies on two supporting interfaces:
PerformanceMessageScriptInfo: Provides details about the script that sent or received the message.PerformanceExecutionContextInfo: Describes the execution context (e.g., main thread, worker) of the sender or receiver.
PerformanceDelayedMessageTiming Interface
This interface provides end-to-end timing for a postMessage event.
The following diagram illustrates the key timestamps:

postMessage Timestamps and Durations:
startTime: The timestamp when thepostMessageAPI is called in the sending context.sentTime: The timestamp when the message is added to the task queue of the receiving browser context or worker.processingStart: The timestamp when the receiving context begins processing the message (i.e., when itsonmessagehandler is about to be executed).processingEnd: The timestamp when the message processing (i.e., theonmessagehandler) is completed in the receiving context.duration: The total time fromstartTimetoprocessingEnd.blockedDuration: The time the message spent waiting in the receiver's task queue aftersentTimebut beforeprocessingStart.
This interface is available in both browser contexts and web workers, providing insights into postMessage timings. For round-trip timing analysis, developers would need to correlate entries from both the sender and receiver contexts (e.g., by sending performance entries back or using a unique identifier).
Instance Properties
This interface extends PerformanceEntry. The following properties are specific to or have special meaning for PerformanceDelayedMessageTiming entries:
PerformanceEntry.entryType
Returns "delayed-message".
PerformanceEntry.name
Returns the name associated with the postMessage event, if one was provided. If no name is provided, it returns an empty string.
To facilitate this, we propose extending the postMessage API to accept an options with a name property. This feature allows developers to assign meaningful names to messages, making it easier to distinguish and analyze them in performance traces, especially in complex applications.
Example:
worker.postMessage({ query: 'find a user' }, { name: 'userSearchQuery' });
PerformanceEntry.startTime
Returns a DOMHighResTimeStamp representing the time when the postMessage was executed in the sending context. The timestamp is relative to the timeOrigin of the context where the PerformanceDelayedMessageTiming entry is observed.
Note for developers: When an entry is observed in a worker for a message sent from the main window (or vice-versa), startTime reflects the sender's clock, adjusted to the observer's timeOrigin. This means startTime can sometimes be a negative value if the sending context was initialized earlier than the observing context. The relative durations provided by the API remain accurate.
PerformanceEntry.duration
Returns a DOMHighResTimeStamp representing the total time from startTime to processingEnd.
PerformanceDelayedMessageTiming.sentTime
Returns a DOMHighResTimeStamp representing the time when the message was added to the task queue of the receiving browser context or worker.
PerformanceDelayedMessageTiming.processingStart
Returns a DOMHighResTimeStamp representing the time when the event dispatch started (i.e., the onmessage handler is about to be executed in the receiving execution context).
PerformanceDelayedMessageTiming.processingEnd
Returns a DOMHighResTimeStamp representing the time when the event dispatch ended (i.e., the onmessage handler completed in the receiving execution context).
PerformanceDelayedMessageTiming.blockedDuration
Returns a DOMHighResTimeStamp representing the duration a dispatched postMessage waited in the task queue of the receiving context after sentTime and before processingStart. It is calculated as processingStart - sentTime.
PerformanceDelayedMessageTiming.serialization
Returns a DOMHighResTimeStamp representing the duration taken by the sending context to serialize the data attached to the message.
PerformanceDelayedMessageTiming.deserialization
Returns a DOMHighResTimeStamp representing the duration taken by the receiving context to deserialize the attached data from the message. This occurs before processingStart.
PerformanceDelayedMessageTiming.taskCount
Returns the total number of queued tasks blocking the postMessage event.
PerformanceDelayedMessageTiming.scriptTaskCount
Returns the total number of all entry-point JavaScript tasks, including those with a duration less than 5ms.
PerformanceDelayedMessageTiming.totalScriptDuration
Returns the cumulative duration (in milliseconds) of all scripts included in scriptTaskCount.
PerformanceDelayedMessageTiming.messageType
Returns a string indicating the type of postMessage communication. Possible values:
"cross-worker-document"(between a worker and a document)"channel"(via aMessageChannel)"cross-document"(between windows/iframes usingwindow.postMessage)"broadcast-channel"(via aBroadcastChannel)
PerformanceDelayedMessageTiming.traceId
Returns a unique identifier (e.g., an incrementing number) for the message. This can help correlate logs or entries if necessary, especially if messages are sent back and forth.
PerformanceDelayedMessageTiming.invoker
Returns a PerformanceMessageScriptInfo instance providing details about the script that sent the message.
PerformanceDelayedMessageTiming.receiver
Returns a PerformanceMessageScriptInfo instance providing details about the script that handled (or is handling) the message.
PerformanceDelayedMessageTiming.scripts
Returns an array of PerformanceScriptTiming instances. These represent the long tasks that were executing on the receiver's thread between sentTime and processingStart, thus contributing to blockedDuration. This leverages the same mechanism as the Long Animation Frames API.
PerformanceMessageScriptInfo Interface
This interface provides insights into the script responsible for sending (invoker) or handling (receiver) a postMessage event.
Instance Properties
PerformanceMessageScriptInfo.name
Returns either "invoker" or "receiver".
PerformanceMessageScriptInfo.sourceFunctionName
Returns the function name associated with sending or handling the postMessage event, if available.
PerformanceMessageScriptInfo.sourceURL
Returns the source URL of the script containing the function responsible for sending or handling the postMessage event.
PerformanceMessageScriptInfo.executionContext
Returns a PerformanceExecutionContextInfo instance containing details about the execution environment of the script.
PerformanceMessageScriptInfo.sourceCharPosition
Returns the character position within the source file where the function responsible for sending or handling the postMessage event begins.
PerformanceMessageScriptInfo.sourceLineNumber
Returns the line number in the source file where the function responsible for sending or handling the postMessage event begins.
PerformanceMessageScriptInfo.sourceColumnNumber
Returns the column number in the source file where the function responsible for sending or handling the postMessage event begins.
PerformanceExecutionContextInfo Interface
This interface provides information about the execution environment (context) where the sender or receiver script is running.
Instance Properties
PerformanceExecutionContextInfo.id
Returns a unique identifier for the execution context (e.g., a string or an integer). For example, the main thread might be "0", the first worker "1", and so on. These IDs are unique within the current agent cluster.
PerformanceExecutionContextInfo.name
Returns the name of the execution context. For web workers, this is the name provided during instantiation (e.g., new Worker("worker.js", { name: "MyWorker" })). It might be empty, as the name is optional. For windows or iframes, it might be empty or derived from window.name.
PerformanceExecutionContextInfo.type
Identifies the type of execution context. Possible values:
"main-thread""dedicated-worker""service-worker""shared-worker""window""iframe"
Monitoring Delayed postMessage Events
Developers can monitor postMessage events that exceed a certain duration threshold using a PerformanceObserver.
const observer = new PerformanceObserver((list) => {
  console.log(list.getEntries());
});

observer.observe({type: 'delayed-message', buffered: true});
durationThreshold
The definition of a "delayed" message can vary by application. The API allows developers to set a durationThreshold (in milliseconds) when observing. Only messages whose total duration (from startTime to processingEnd) exceeds this threshold will generate a performance entry.
- The default
durationThresholdis 200ms. - A minimum threshold (e.g., 50ms) will be enforced to prevent excessive entry generation for very frequent, short messages.
// Observe entries where the total duration exceeds 50ms
observer.observe({ type: "delayed-message", durationThreshold: 50, buffered: true });
Examples of a delayed-message Performance Entry
The following JSON shows sample performance entries for the delayed messages identified in Case 1: Thread Being Occupied. This API automatically detects and reports these delays without requiring manual performance.now() tracking.
By examining blockedDuration and the handler execution time (processingEnd - processingStart), developers can diagnose the cause:
- In the first entry (message #4),
durationis121ms, and the handler execution time (processingEnd - processingStart), which is121.1ms.blockedDurationis0ms. This indicates the message's own handler was long, causing the overall delay. - In the second entry (message #5), the handler time is
51.5ms. However,blockedDurationis60.0ms. This shows that other tasks were occupying the worker's event loop, preventing this message from being handled promptly. Thescriptsproperty (shown for the second entry) would list these blocking tasks.
[
   {
      "name": "delayed-message",
      "entryType": "delayed-message",
      "startTime": 212.80000019073486,
      "duration": 121,
      "traceId": 4,
      "messageType": "cross-worker-document",
      "sentTime": 213,
      "processingStart": 213.30000019073486,
      "processingEnd": 334.40000009536743,
      "blockedDuration": 0,
      "serializeDuration": 0,
      "deserializeDuration": 0,
      "taskCount": 13,
      "scriptTaskCount": 1,
      "totalScriptDuration": 2,
      "scripts": [],
      "invoker": {
          "name": "invoker",
          "sourceURL": "https://joone.github.io/web/explainers/delayed_messages/long_task/main.js",
          "sourceFunctionName": "sendMessage",
          "sourceCharPosition": 510,
          "sourceColumnNumber": 14,
          "sourceLineNumber": 15,
          "executionContext": {
              "name": "",
              "type": "window",
              "id": 0
          }
      },
      "receiver": {
          "name": "receiver",
          "sourceURL": "https://joone.github.io/web/explainers/delayed_messages/long_task/worker.js",
          "sourceFunctionName": "runLongTaskOnWorker",
          "sourceCharPosition": 168,
          "sourceColumnNumber": 41,
          "sourceLineNumber": 8,
          "executionContext": {
              "name": "",
              "type": "dedicated-worker",
              "id": 1
          }
      }
  },
  {
      "name": "delayed-message",
      "entryType": "delayed-message",
      "startTime": 274.40000009536743,
      "duration": 112,
      "traceId": 5,
      "messageType": "cross-worker-document",
      "sentTime": 274.5,
      "processingStart": 335.19999980926514,
      "processingEnd": 386.69999980926514,
      "blockedDuration": 60,
      "serializeDuration": 0,
      "deserializeDuration": 0,
      "taskCount": 27,
      "scriptTaskCount": 2,
      "totalScriptDuration": 123,
      "scripts": [
          {
              "name": "script",
              "entryType": "script",
              "startTime": 213.30000019073486,
              "duration": 121,
              "invoker": "DedicatedWorkerGlobalScope.onmessage",
              "invokerType": "event-listener",
              "windowAttribution": "other",
              "executionStart": 213.30000019073486,
              "forcedStyleAndLayoutDuration": 0,
              "pauseDuration": 0,
              "sourceURL": "https://joone.github.io/web/explainers/delayed_messages/long_task/worker.js",
              "sourceFunctionName": "runLongTaskOnWorker",
              "sourceCharPosition": 168,
              "sourceLine": 8,
              "sourceColumn": 41
          }
      ],
      "invoker": {
          "name": "invoker",
          "sourceURL": "https://joone.github.io/web/explainers/delayed_messages/long_task/main.js",
          "sourceFunctionName": "sendMessage",
          "sourceCharPosition": 510,
          "sourceColumnNumber": 14,
          "sourceLineNumber": 15,
          "executionContext": {
              "name": "",
              "type": "window",
              "id": 0
          }
      },
      "receiver": {
          "name": "receiver",
          "sourceURL": "https://joone.github.io/web/explainers/delayed_messages/long_task/worker.js",
          "sourceFunctionName": "runLongTaskOnWorker",
          "sourceCharPosition": 168,
          "sourceColumnNumber": 41,
          "sourceLineNumber": 8,
          "executionContext": {
              "name": "",
              "type": "dedicated-worker",
              "id": 1
          }
      }
  }
]
Alternatives Considered
DevTools Tracing
Modern browser developer tools offer tracing capabilities that can show postMessage events and task execution timelines. While useful for manual inspection, these tools are not designed for systematic, large-scale metric collection, aggregation, or automated performance monitoring in production environments.
The proposed API offers structured timing data suitable for production monitoring. It enables automated monitoring and performance attribution without requiring manual tooling, developer intervention, or complex trace analysis.
Manual Instrumentation / Polyfills
Developers can attempt to wrap postMessage() calls and onmessage handlers with their own timing logic (e.g., using performance.now()). However, this approach has several drawbacks:
- It's challenging to intercept all messages, especially those from third-party libraries.
- Accurately measuring internal browser operations like serialization, deserialization, and precise queue waiting time is not feasible from JavaScript.
A native API can provide more accurate and comprehensive data with lower overhead.
Security and Privacy Considerations
This API is designed to provide developers with insights into the performance of their own applications and does not introduce new cross-origin information leakage.
- Same-Origin Data:
PerformanceDelayedMessageTimingentries are only exposed to the same origin that initiated and received the messages. Information about message timings betweenA.comand an iframe fromB.comwould only be available toA.comif it can observe the receiver inB.com(which generally requiresB.comto cooperate) or vice-versa, subject to standard cross-origin policies. Thescriptsproperty, which details blocking tasks, also only contains information about same-origin scripts. - No New Cross-Origin Information: The API does not expose any new information about cross-origin interactions that isn't already observable through other means (e.g., whether a message was sent or received). Details of cross-origin execution contexts or script contents are not revealed.
- Fingerprinting: The risk of this API being used for user fingerprinting is considered low.
- The information provided is about the performance characteristics of the web application itself, not the user's underlying system hardware beyond what influences JavaScript execution speed.
- The
durationThresholdfor observing entries limits the granularity and volume of data reported, making it less suitable for creating a detailed fingerprint. - While timing variations could exist, they are more likely attributable to the application's state and workload rather than unique user environment characteristics.
Discussion
Minimum Duration for Delayed Messages (durationThreshold)
We propose a default durationThreshold of 200ms for identifying delayed messages. However, the impact of a delay can be context-dependent. For example, a 100ms delay might not cause any issues in a background worker task, but the same delay could be noticeable to users if it affects communication between an iframe and its parent window during a user interaction.
To address this, the API makes durationThreshold configurable by the developer. This allows developers to adjust the threshold to their specific application's performance requirements and specific use cases. In addition, the durationThreshold also helps ensure that data is only collected for messages that are genuinely problematic, reducing unnecessary monitoring overhead.
Further discussion is needed to determine the minimum allowed value for this threshold (e.g., 50ms as suggested) to ensure it remains useful without introducing significant performance costs.
Related Discussion, Articles, and Browser Issues
-
Chromium Issue: Support Long Tasks API in workers
Web developers are interested in extending the Long Tasks API to monitor delayed execution in web workers. However, unlike the Long Animation Frames (LoAF) API, the current Long Tasks API lacks script attribution, making it harder to trace the source of delays. -
Chromium Issue: postMessage between Trello and iframes timing out more frequently
This issue highlights increasing latency inpostMessagecommunication between Trello and embedded iframes, suggesting a need for better diagnostics around message delivery delays. -
Article: Is postMessage slow?
This article explains how serialization and deserialization are major sources of delay inpostMessage()usage. WhileSharedArrayBuffercan, in theory, eliminate copying overhead by enabling shared memory, its real-world usage is limited due to strict security constraints and the added complexity of manual memory management and thread synchronization.
Acknowledgements
Thank you to Abhishek Shanthkumar, Alex Russell, Andy Luhrs, Dave Meyers, Ethan Bernstein, Evan Stade, Jared Mitchell, Luis Pardo, Michal Mocny, Noam Helfman, Noam Rosenthal, Sam Fortiner, Samuele Carpineti, Steve Becker, Yoav Weiss, Yehor Lvivski for their valuable feedback and advice.
References
- Event Timing API
- Extending Long Tasks API to Web Workers
- https://developer.mozilla.org/en-US/docs/Web/API/PerformanceLongTaskTiming
- https://developer.mozilla.org/en-US/docs/Web/API/PerformanceScriptTiming
- https://developer.mozilla.org/en-US/docs/Web/API/MessageEvent
- https://developer.chrome.com/docs/web-platform/long-animation-frames